


Posted inBlog
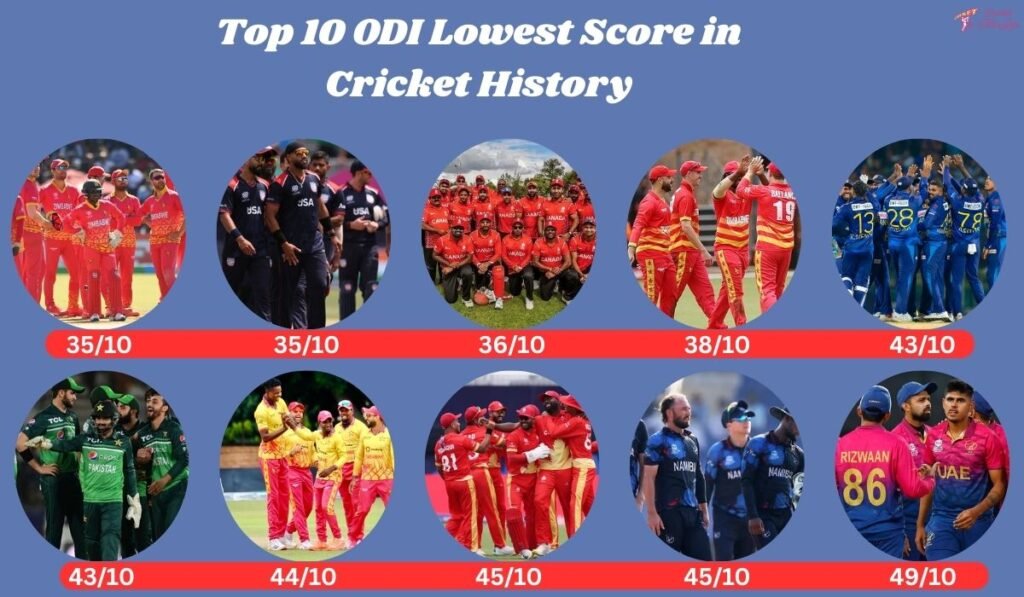
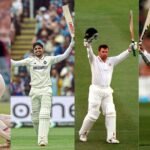
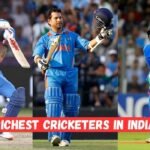
Indian Cricketers Net Worth 2026 in Rupees | Sachin, Kohli, Dhoni & More
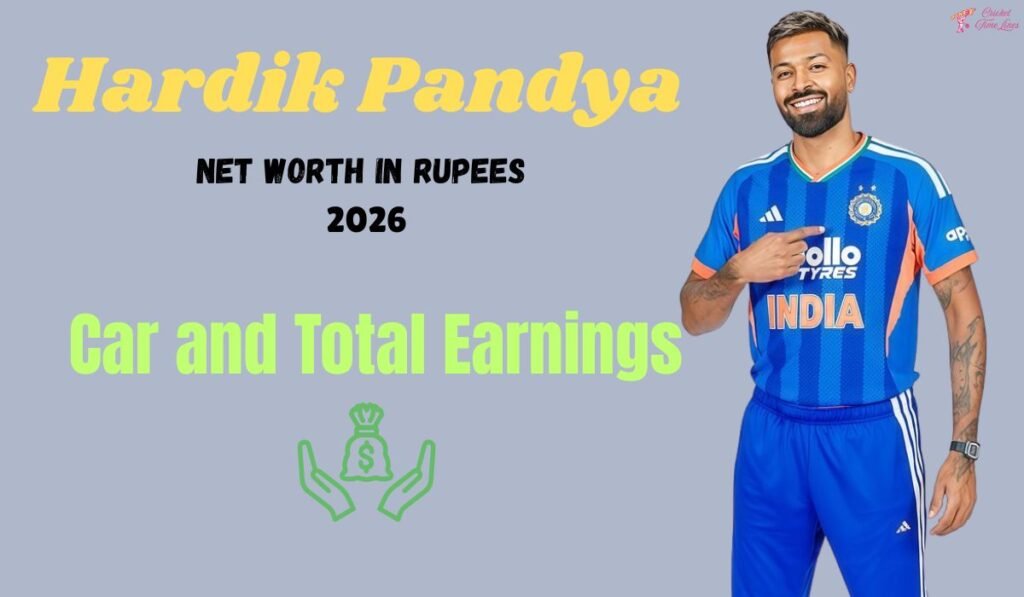
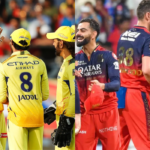
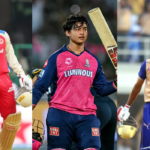
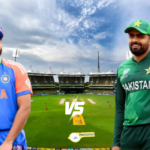
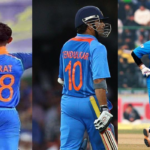
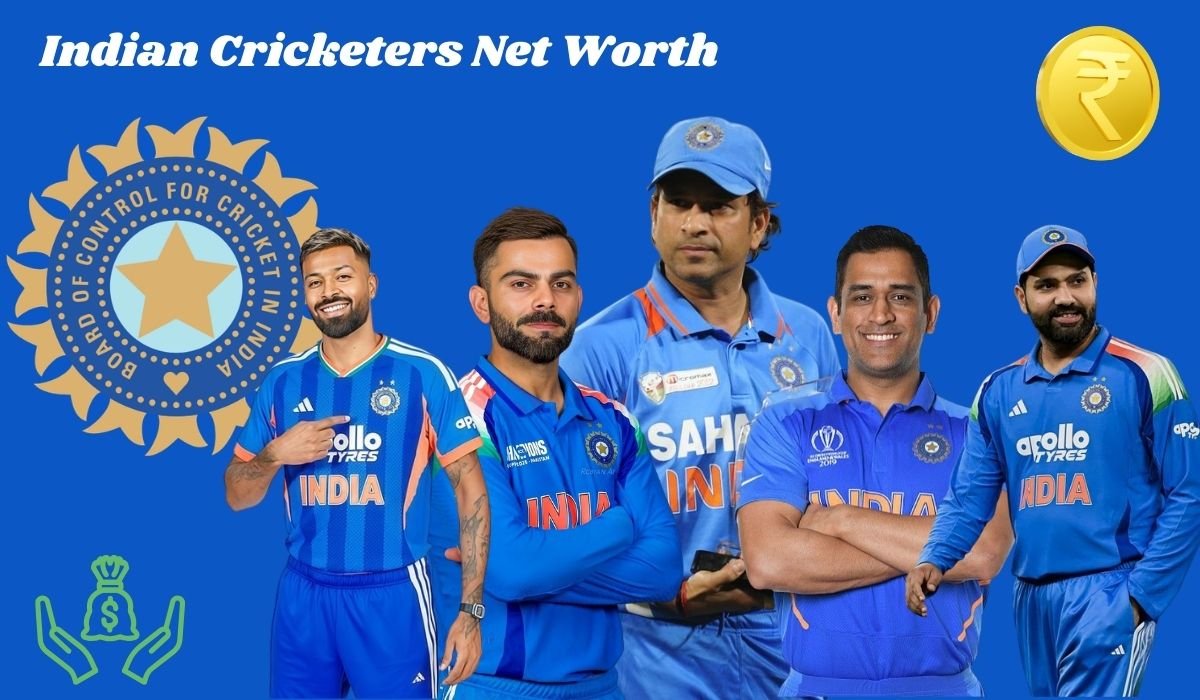
In India, cricket is not just a sport - it is big business, where talent meets enormous financial opportunity. From legendary players like Sachin Tendulkar and MS Dhoni to pad…